

Exchange traded funds are well established in the investment marketplace, in part due to the ease of trading them. Investors have come to appreciate the stock-like attributes of ETF trading, but there are some differences that must be acknowledged.
In this blog post, we’ll delve into the often-misunderstood aspects of ETF liquidity, addressing the most common questions our Mackenzie ETF specialist team receives from advisors in the field. By exploring the hidden layers of liquidity, we aim to provide you with key insights that will enhance your understanding and help you make more informed investment decisions.
Here are three key takeaways for our readers:
- Implied liquidity vs. volume: The volume of an ETF only shows what has been traded, not its true liquidity. True liquidity, or implied liquidity, refers to the liquidity of the ETF’s underlying holdings. An ETF is as liquid as its underlying holdings.
- On-screen liquidity: On-screen liquidity may only capture a portion of all the ETF trading volume through one or two exchanges. In reality, ETFs trade on multiple exchanges, providing a broader picture of their liquidity.
- Support for large or complex trades: For any large or complex trades, advisors can contact their ETF trading desk and/or the ETF issuer. For instance, Mackenzie Investments has a dedicated ETF capital markets specialist to assist advisors.
Recently, I had the privilege of attending an advisor event hosted by Mackenzie Investments with a colleague, who was presenting on ETFs. During the Q&A session, we received several questions about ETF liquidity, including: “Is it easier to trade in and out of a low volume, low AUM ETF?”
To address this question, let’s dive into the dynamics of ETF liquidity. Before we tackle some common misconceptions surrounding liquidity, it’s important to understand the different layers that make up true ETF liquidity.
The three layers of ETF liquidity
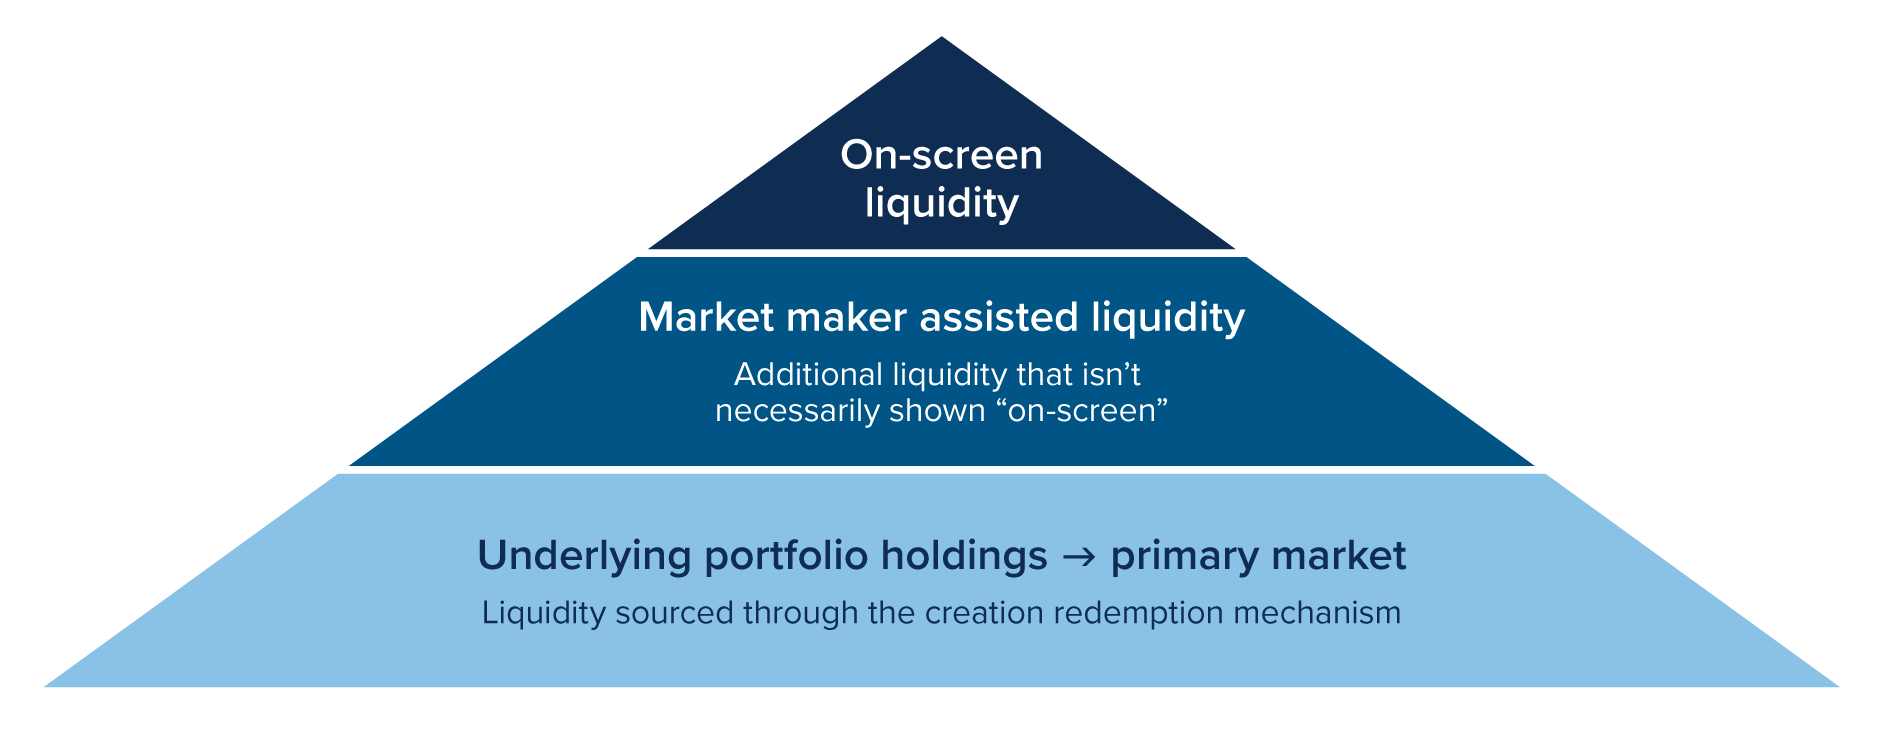
On-screen liquidity
This refers to the liquidity available through the exchange, which most investors are familiar with. Like stocks, buyers and sellers of an ETF can view the bid/ask spread and volume data through various sources and trading platforms. A unique aspect of ETFs is that market makers act as intermediaries between ETF issuers and the exchange, ensuring the ETF price aligns with its fair market value. Bid and ask quotes are available during trading hours. It’s important to note that trading platforms often display volume data from only one or two major exchanges. In reality, ETFs in Canada are traded on multiple exchanges, so the displayed data only captures partial trading volume and liquidity.
Market maker assisted liquidity
Market makers are dealers or brokers who hold an inventory of ETFs and will buy or sell ETFs based on demand and supply. A key point is that they only display a fraction of the inventory they are willing to trade to better manage risks associated with significant market moves. Advisors looking to trade beyond the displayed inventory can use limit orders at a stated price or consult their ETF trading desk or ETF specialist at the issuer firm.
Primary market liquidity
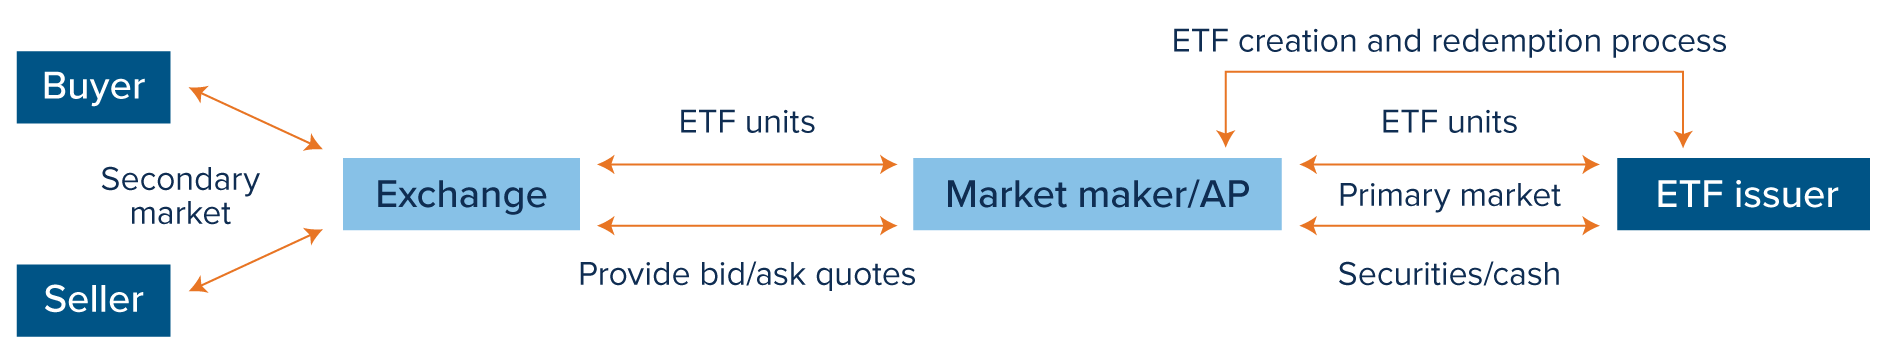
This is where an ETF differentiates itself from stocks in terms of liquidity. In the primary market, market makers and ETF issuer firms interact through the creation and redemption process. For example, if a market maker receives a large order to buy a Mackenzie ETF, they will inform the Mackenzie ETF team who will create ETF units and transfer them to the market maker in exchange for either cash or underlying securities of equivalent notional value. This process also works in reverse for large sell orders of Mackenzie ETFs. Exhibit 1 illustrates the primary and secondary market process.
Exhibit 1
Now, let’s revisit some of the questions or misconceptions that we often hear from investors and advisors regarding ETF liquidity, which we frequently addresses during seminars and presentations.
I like your ETF, but it has low volume and AUM.
Like stocks, most investors and advisors assess an ETF’s liquidity using metrics such as current average daily volume (ADV) or 30-day ADV. However, it’s important to note that ADV is a backward-looking indicator for ETFs. A more precise metric is the ETF’s implied liquidity, which is forward-looking. This means an ETF is as liquid as its underlying basket of securities. Since ETFs are open-ended investment vehicles, they can issue an unlimited number of units, unlike stocks, which have a fixed number of shares at any given time.
For example, consider the Mackenzie Canadian Low Volatility ETF (MCLV), which launched in June 2024. Although it has lower AUM compared to other established ETFs, Table 1 shows a 90-day average volume of 21,200 units, AUM of $104.71 million and implied liquidity of 8.7 million shares. This means an investor can buy up to 8.7 million shares of MCLV ETF, which is 410 times larger than its 90-day average volume.
Table 1
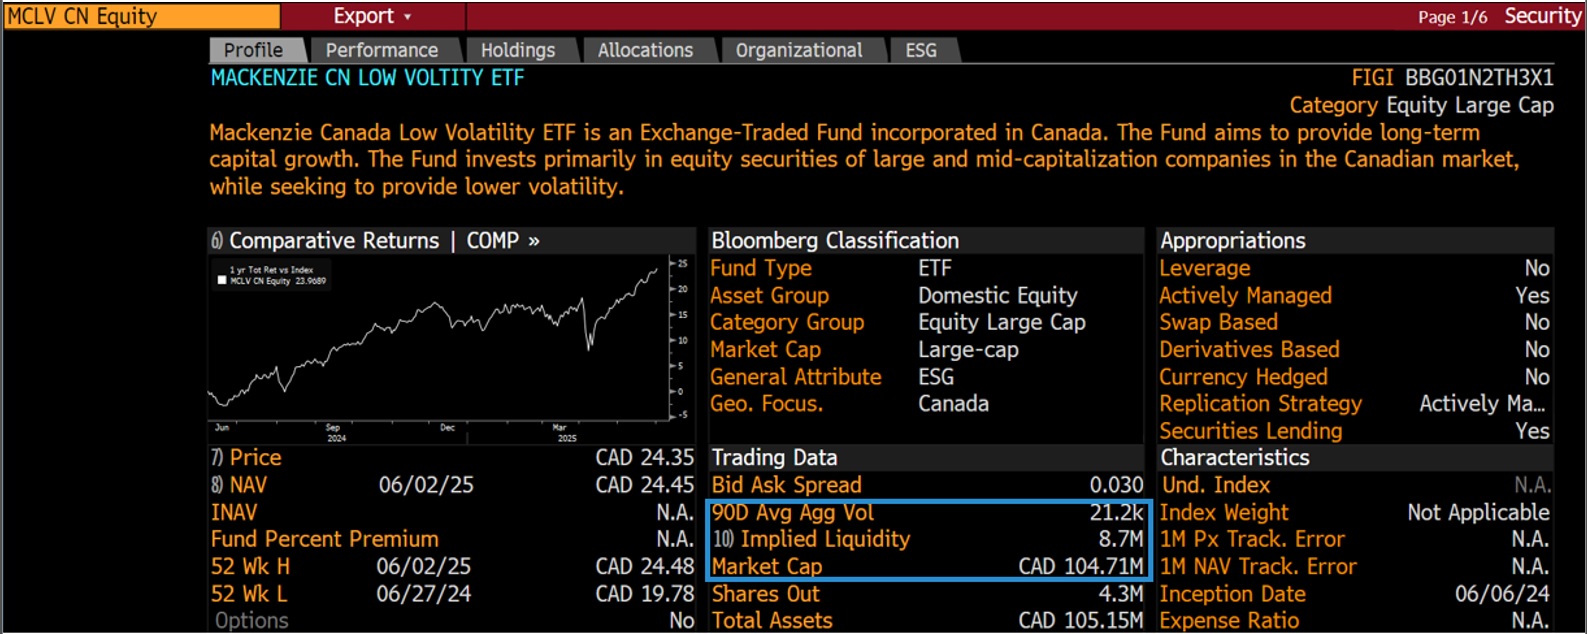 Source: Bloomberg, data as of June 3, 2025.
Will a large trade affect the ETF price?
The short answer is no. Because of the ETF’s implied liquidity, it can handle large buy or sell orders without any issues. If an advisor needs to place a large block order, we highly encourage them to reach out to their trading desk or the ETF issuer. For instance, earlier this year, an advisor bought approximately 623,000 shares of MCLV at $22.99 (Table 2). Despite the 90-day average volume being around 20,800 shares (Table 1), we were able to complete this transaction, which was almost 30 times the daily volume, without distorting the price of MCLV.
This scenario illustrates the creation process in the primary market between the market maker and the ETF issuer. The process and outcome would be similar if someone wanted to sell a large block of units. A capital market specialist can act as a liaison between the market maker and buyer or seller.
Table 2
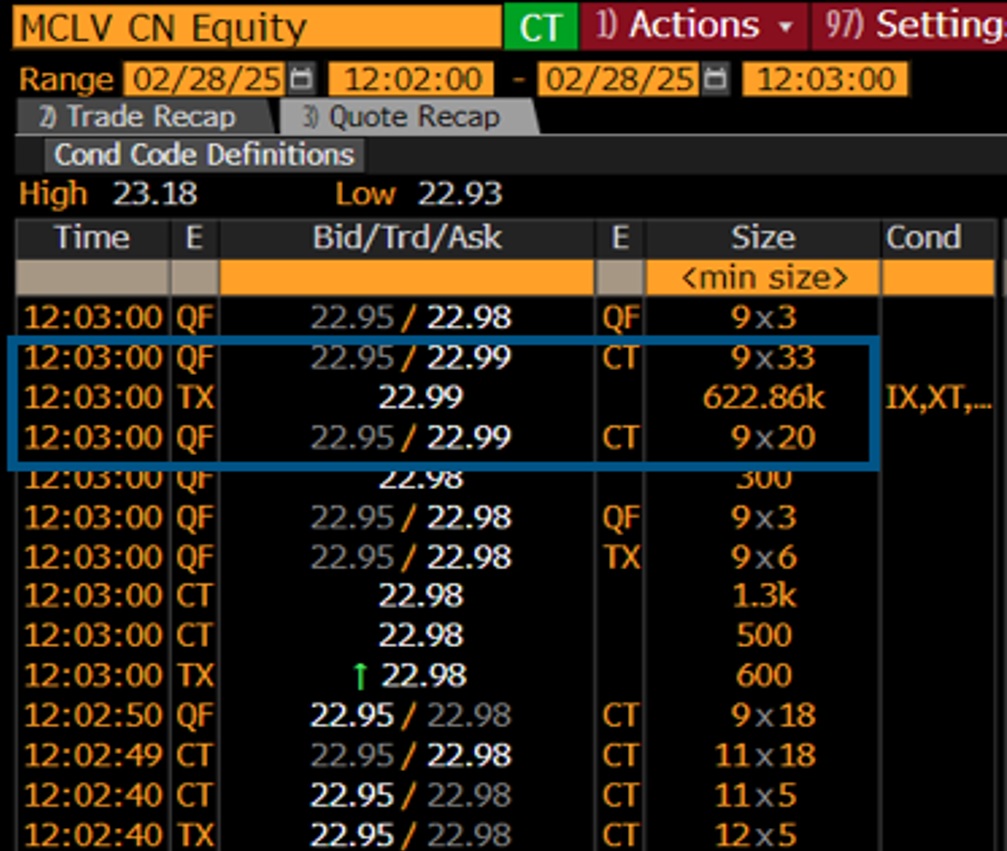 Source: Bloomberg, data as of February 28, 2025
ETF liquidity is a multifaceted concept that extends far beyond the visible trading volume. The true liquidity of an ETF is primarily determined by the liquidity of its underlying assets. While investors tend to focus on on-screen liquidity, it only represents a fraction of trading activity, as ETFs trade across multiple exchanges, providing deeper liquidity.
For large or complex trades, the support of ETF trading desks or the ETF issuer is crucial, as they can help execute these trades efficiently without significant price impact.
Even ETFs with lower trading volumes and assets under management, can still accommodate substantial trades due to their unique structural and liquidity mechanisms. By understanding these dynamics, investors can make more informed decisions and optimize their trading strategies.
To learn more, please feel free to reach out to the ETF specialist team at Mackenzie Investments.
Commissions, management fees, brokerage fees and expenses may all be associated with Exchange Traded Funds. Please read the prospectus before investing. The indicated rates of return are the historical annual compounded total returns including changes in unit value and reinvestment of all distributions, and do not take into account sales, redemption, distribution, or optional charges or income taxes payable by any security holder that would have reduced returns. Exchange Traded Funds are not guaranteed, their values change frequently, and past performance may not be repeated.
Index performance does not include the impact of fees, commissions, and expenses that would be payable by investors in the investment products that seek to track an index.
The content of this article (including facts, views, opinions, recommendations, descriptions of or references to, products or securities) is not to be used or construed as investment advice, as an offer to sell or the solicitation of an offer to buy, or an endorsement, recommendation or sponsorship of any entity or security cited. Although we endeavour to ensure its accuracy and completeness, we assume no responsibility for any reliance upon it.
This article should not be construed as legal, tax or accounting advice. This material has been prepared for information purposes only. Any tax information provided in this document is general in nature and each client should consult with their own tax advisor, accountant and lawyer before pursuing any strategy described herein as each client’s individual circumstances are unique. We have endeavored to ensure the accuracy of the information provided at the time that it was written, however, should the information in this document be incorrect or incomplete or should the law or its interpretation change after the date of this document, the advice provided may be incorrect or inappropriate. There should be no expectation that the information will be updated, supplemented or revised whether as a result of new information, changing circumstances, future events or otherwise. We are not responsible for errors contained in this document or to anyone who relies on the information contained in this document. Please consult your own legal and tax advisor.
This article may contain forward-looking information which reflect our or third-party current expectations or forecasts of future events. Forward-looking information is inherently subject to, among other things, risks, uncertainties and assumptions that could cause actual results to differ materially from those expressed herein. These risks, uncertainties and assumptions include, without limitation, general economic, political and market factors, interest and foreign exchange rates, the volatility of equity and capital markets, business competition, technological change, changes in government regulations, changes in tax laws, unexpected judicial or regulatory proceedings and catastrophic events. Please consider these and other factors carefully and not place undue reliance on forward-looking information. The forward-looking information contained herein is current only as of February 28, 2025. There should be no expectation that such information will in all circumstances be updated, supplemented or revised whether as a result of new information, changing circumstances, future events or otherwise.