
Written by the Mackenzie Fixed Income Team
Key Highlights
- The Bank of Canada is expected to reach a neutral policy rate of 2.75% faster than the Federal Reserve due to Canada’s economic underperformance and excess supply.
- While remaining positive on nominal duration in North America, there is a gradual shift towards US duration as more rate cuts are anticipated in Canada.
- The market may be underestimating the Bank of Japan’s hawkish stance, with a potential rate hike expected before year-end, presenting an opportunity for short Japan Government Bond trades.
- Sluggish economic data from China and a potential slowdown in the US could hinder global growth
- Overweight exposure to select hybrids and LRCNs is beneficial, while caution is advised on high yield. CDX options are used to hedge spread risk effectively.
- In emerging markets, there is a preference for South African government bonds over Brazil and Mexico, with selective exposure due to anticipated Federal Reserve rate cuts.
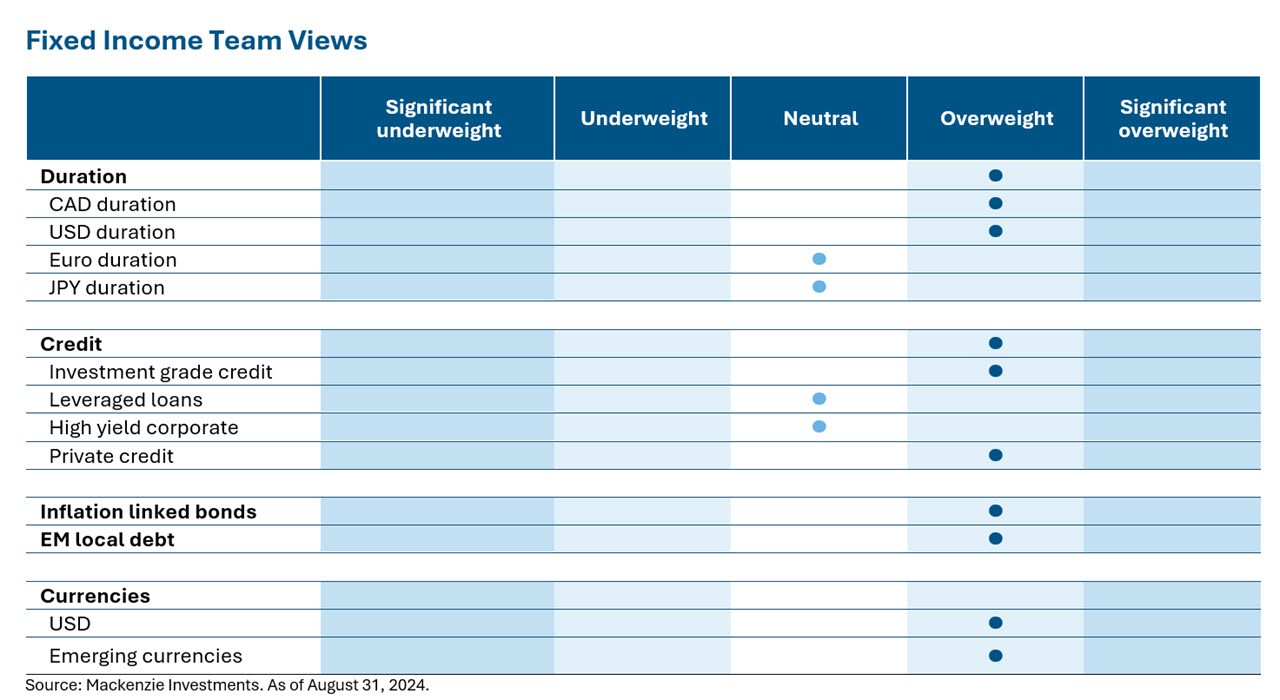
Fixed Income Team Views
Central Bank Watch
US Fed (Fed)
Inflation extended a run of cooler readings in July at 2.9% y/y, the lowest reading since 2021. Core inflation, which excludes volatile food and energy items, was 3.2%, also a three-year low. The core PCE data, Fed’s preferred inflation gauge at 2.6%, supports forecasts of moderate, rather than rushed, interest rate cuts starting next month. Federal Reserve Chair strongly indicated that interest-rate cuts are imminent, aiming to prevent further weakening of the U.S. labor market. “The time has come for policy to adjust” Powell stated during the Jackson Hole summit. He further remarked “The direction of travel is clear, and the timing and pace of rate cuts will depend on incoming data, the evolving outlook, and the balance of risks”. The primary uncertainty for financial markets is the extent of the rate cuts in mid-September. Market participants are divided on whether the Fed will reduce the rate by 0.25 or 0.5 percentage points at the upcoming meeting. There is also uncertainty about the Fed’s actions in its November and December meetings.
Bank of Canada (BoC)
In July, headline inflation slowed to 2.5%, with key pressures remaining concentrated. This trend is likely to keep the BoC on its path of rate cuts. Although Canada’s economy grew at an annualized rate of 2.1% in the second quarter, much of this growth was fueled by government spending. Early indicators suggest a slower pace in the third quarter. Since the BoC’s meeting on July 24, most key data have underperformed expectations: manufacturing PMIs have weakened, inflation has decelerated, and employment has declined. These developments suggest to us that the BoC will view the economy as having excess supply, justifying further rate cuts.
European Central Bank (ECB)
German inflation fell more than anticipated this month, dropping below the European Central Bank’s (ECB) target and significantly increasing the likelihood of a key interest rate cut at the September meeting. Consumer prices in Germany rose by 1.9% y/y in August, down from 2.3% in July, lowest inflation rate since March 2021. The decline in inflation heightens the pressure on the ECB to lower rates next month, following its first deposit rate cut since 2019 in June. Policymakers emphasize the need for sustained evidence of easing inflationary pressures, including cooling wage growth. Notably, inflation in the labor-intensive services sector remains elevated at 3.9%.
Bank of Japan (BoJ)
Consumer inflation in the Tokyo accelerated in August, exceeding expectations and fueling speculation of an imminent interest rate hike by the Bank of Japan. The core consumer-price index, excluding fresh food, rose by 2.4% year-on-year in August, up from 2.2% in July, partly due to the reduction of energy subsidies, according to government data released on Friday. The increase in inflation and economic activity strengthens the anticipation of further rate hikes by the Bank of Japan. Governor Kazuo Ueda and other senior officials have indicated that additional rate increases will be considered if economic and inflation data align with their projections.
Emerging Markets (EM)
Mexico’s central bank unexpectedly reduced its policy rate by 25 basis points to 10.75%, marking the first cut since March. This move signals a shift in focus from recent inflation spikes to potential economic growth threats. Concerns about the new administration’s ability to implement fiscal consolidation and the controversial judicial reform plan continue to weigh on the local currency and credit rating. In Brazil, the central bank maintained its benchmark Selic rate at 10.5% for the second consecutive month, highlighting emerging risks to the consumer price outlook. Although the tone was more hawkish, it did not clearly indicate an imminent rate hike. However, market expectations for a Selic rate increase before year-end persist. South African local bonds have gained following the rise of a business-friendly coalition two months ago, coupled with improving economic data. The decline in inflation since February has eased pressure on the central bank to maintain high interest rates. Anticipated Federal Reserve rate cuts next month may pave the way for similar actions by South African policymakers.
Duration and Curve Positioning
We believe the Bank of Canada has a greater need and is likely to reach a neutral policy rate of 2.75% faster than the Federal Reserve, given the Canadian economy’s underperformance and excess supply. We remain constructive on nominal duration in North America. However, as more rate cuts are priced in Canada, we are gradually rotating towards US duration. We think the market is mispricing the Bank of Japan’s hawkish stance and anticipate a rate hike before year-end, potentially creating an opportunity to re-enter the short Japan Government Bond trade. The sluggishness in China’s economic data is significant for global growth. If the US economy also slows down, it could negatively impact Europe while potentially benefiting European duration. The combined slowdown in China and the US would hinder global growth, affecting the three major growth engines. On the corporate side, our overweight exposure to select hybrids and Limited Recourse Capital Notes (LRCNs) continues to contribute to performance. We remain cautious on high yield as valuations remain expensive, favoring higher quality BB-rated securities. In emerging markets, while there is a strong tailwind from the anticipated rate cuts by the Federal Reserve, allowing EM central banks to cut policy rates, we remain extremely selective. We favor local South African government bond exposure over Brazil and Mexico. As part of our risk management toolkit, we utilize CDX options cost-effectively to hedge spread risk. We maintain a neutral view on loans, seeing a good opportunity to receive higher coupons and favoring higher quality loans in the current economic cycle.
Investment Grade Corporates (IG)
US IG outperformed Canadian IG corporates with a return of 1.5% and 0.45% respectively for the month. The yield to maturity dropped by 22bps in the US v/s 7bps in Canada. The performance was driven by rates rally on rising policy rate cut expectations fueled by explicit dovish Fed comments. With the Fed like to cut rates in the upcoming meeting, investment grade credit spreads were relatively unchanged for the month at 97bps and 130bps accordingly. The favourable backdrop of falling yields and lower spreads followed an extremely active primary market with corporate issuance of US$109bn and CA$6.5bn in the month.
High Yield Bonds (HY)
High-yield bonds posted their strongest back-to-back gains of 2024 in August alongside falling treasury yields, amid resilient US growth data and as earnings met elevated consensus. Chair Powell’s remarks at the Jackson Hole forum left little room for doubt that the Fed will soon be cutting rates. High-yield bond yields and spreads decreased 27bp and 4bp in August to 7.44% and 359bp, respectively. Including distressed exchanges, the par-weighted US high-yield bond default rates decreased 4bp to 1.73%. The HY index gained +1.69% in August. By rating, CCC bonds outperformed with returns of +2.20%, compared with returns of +1.70% for BB bonds and +1.61% for B bonds. We feel the bonds are priced for perfection and continue to be cautious in our credit selection
Leveraged Loans (LL)
Loans’ +0.63% monthly return in August was the lowest among the other fixed income asset classes as yields legged lower in July in anticipation of further rate cuts this year, driving solid outperformance for fixed-rate instruments relative to loans (i.e., duration outperformed for the month). “Higher-for-Longer” is losing momentum as the market is now pricing in 100bps of rate cuts in 2024. However, elevated coupons in the loan market will continue till rate cuts pile and add up; this is positive for loans if the economy is still performing well with no hard landing in sight.
Bond Stories
Investment Grade – Algonquin Power
Algonquin Power/Liberty Power (“The Issuer”) is the wholly owned renewable energy arm of Algonquin Power & Utilities Corp (“AQN”). As of Q2 2024, the Company has net interests in over 4 GW of installed renewable energy capacity and about 87% of its generation are under long-term contracts with a weighted average tenor of about 10 years with mostly IG counterparties. Although Liberty Power was facing negative headlines over the last few years, we continued to hold a significant chunk of the 31s given contracted nature of company’s cash flows and expectation that the AQN would eventually sell off its power generation business to help with strengthening its balance sheet. In August, that thesis pretty much played out with AQN announcing sale of its power generation business to LS Power. The announcement resulted in the expectation of Change of Control clause being triggered on the bonds which resulted in the bonds returning 7.8% during the month.
High Yield Bond – CommScope
CommScope is a provider of broadband and wireless equipment to telecommunication customers. The company’s main products include cables such as fiber, coax and copper, wireless antennas and filters, network management solutions amongst others. In 2023 and early 2024, the company experienced declining revenue as customer orders weakened. Considering the company’s high existing debt load, leverage reached over 10x and both the secured and unsecured bonds came under heavy pressure. However, the past two quarters showed signs of a cyclical recovery, with customer orders and management’s outlook both coming ahead of previous expectations. Together with a $2.1 billion non-core asset sale and lower risks of a Liability Management Exercise (LME), bond prices staged a significant recovery and were notable contributors in August.
ESG – Seaspan 5.5% ‘29 Blue Bond
Seaspan is one of the largest independent containership owners and lessors in the world. As of Dec 2023, the company’s fleet consisted of over 153 containerships representing a total capacity of ~1.538 million TEU and an average age of 7.3 years. We like Seaspan given the company’s position as one of the largest independent lessors in the vessel leasing business, a history of strong utilization rate of its fleet (>90%) and contracts signed with customers which increases visibility of cash flows. The ownership of the company by strong sponsors in the form of Fairfax Financial (BBB/Baa2 by S&P/Moodys) and Washington Group provides additional comfort.
Finally, in terms of medium-term catalyst, we expected the company’s profitability to increase as new vessels entered its fleet. This thesis played out in August when the Company reported strong Q2 numbers driven by the new vessels entering its fleet and a broader strong operating environment for containership lessors. This led to bonds returning >5% in August. Blue bonds finance projects related to ocean conservation, and in this case, the use of proceeds of this bond was to fund the acquisition of LNG fueled vessels. LNG fueled vessels emit ~20% lower carbon emissions than conventional fuel vessels.
Commissions, trailing commissions, management fees, and expenses all may be associated with mutual fund investments. Please read the prospectus before investing. The indicated rates of return are the historical annual compounded total returns as of June 30, 2024, including changes in share value and reinvestment of all distributions and does not take into account sales, redemption, distribution, or optional charges or income taxes payable by any security holder that would have reduced returns. Mutual funds are not guaranteed, their values change frequently, and past performance may not be repeated. Index performance does not include the impact of fees, commissions, and expenses that would be payable by investors in the investment products that seek to track an index.
Index performance does not include the impact of fees, commissions, and expenses that would be payable by investors in investment products that seek to track an index.
This document may contain forward-looking information which reflect our or third party current expectations or forecasts of future events. Forward-looking information is inherently subject to, among other things, risks, uncertainties and assumptions that could cause actual results to differ materially from those expressed herein. These risks, uncertainties and assumptions include, without limitation, general economic, political and market factors, interest and foreign exchange rates, the volatility of equity and capital markets, business competition, technological change, changes in government regulations, changes in tax laws, unexpected judicial or regulatory proceedings and catastrophic events. Please consider these and other factors carefully and not place undue reliance on forward-looking information. The forward-looking information contained herein is current only as of August 31, 2024. There should be no expectation that such information will in all circumstances be updated, supplemented or revised whether as a result of new information, changing circumstances, future events or otherwise.
The content of this commentary (including facts, views, opinions, recommendations, descriptions of or references to, products or securities) is not to be used or construed as investment advice, as an offer to sell or the solicitation of an offer to buy, or an endorsement, recommendation or sponsorship of any entity or security cited. Although we endeavour to ensure its accuracy and completeness, we assume no responsibility for any reliance upon it.
All information is historical and not indicative of future results. Current performance may be lower or higher than the quoted past performance, which cannot guarantee results. Share price, principal value, and return will vary, and you may have a gain or a loss when you sell your shares. Performance assumes reinvestment of distributions and does not account for taxes. Performance may not reflect any expense limitation or subsidies currently in effect. Short-term trading fees may apply.
This material is for informational and educational purposes only. It is not a recommendation of any specific investment product, strategy, or decision, and is not intended to suggest taking or refraining from any course of action. It is not intended to address the needs, circumstances, and objectives of any specific investor. Mackenzie Investments, which earns fees when clients select its products and services, is not offering impartial advice in a fiduciary capacity in providing this sales and marketing material. This information is not meant as tax or legal advice. Investors should consult a professional advisor before making investment and financial decisions and for more information on tax rules and other laws, which are complex and subject to change.
The rate of return is used only to illustrate the effects of the compound growth rate and is not intended to reflect future values of the mutual fund or returns on investment in the mutual fund.