
Written by the Mackenzie Fixed Income Team
Key Highlights
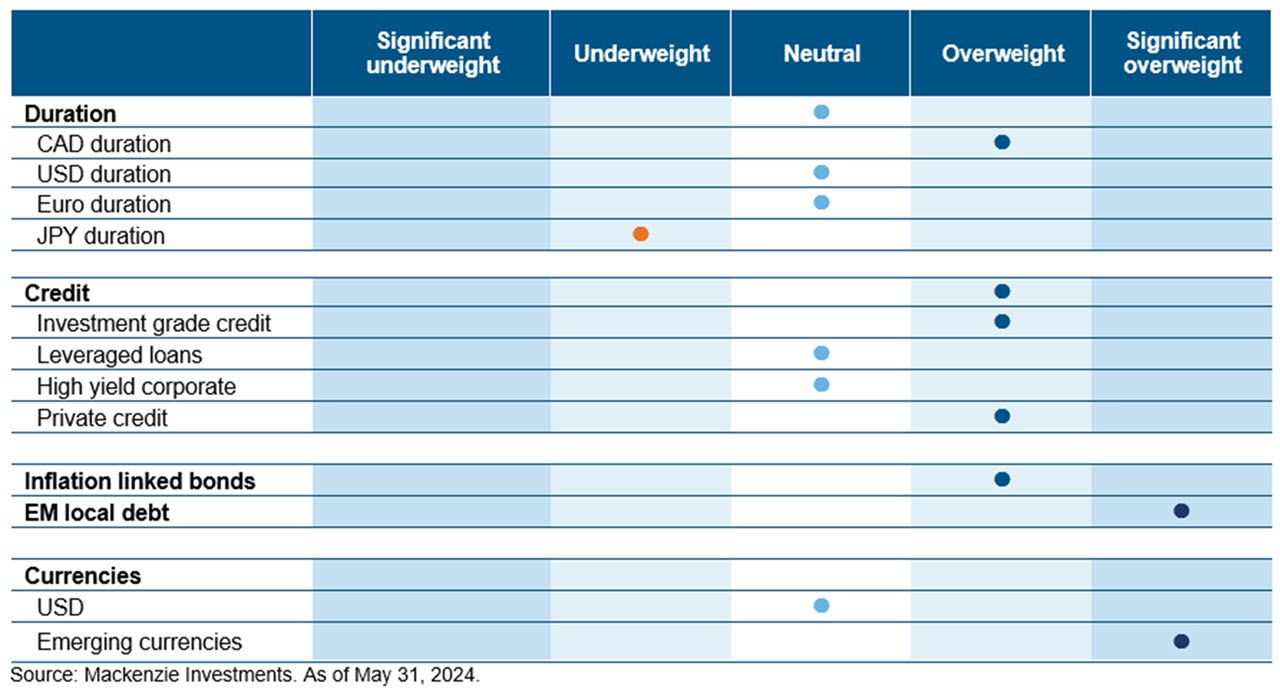
- We continue to believe inflation trending lower and weaker labor markets in Canada may lead to divergence in monetary policy actions for BoC versus the U.S Fed.
- We prefer to be invested in high-grade corporate bonds at the short end of the curve and prefer the Canadian yield curve over the US in this segment.
- We remain cautious on high yield over potential economic slowdown concerns in a higher for longer rate environment amid tighter corporate spreads (expensive valuations).
- We maintain our strategic position in long-dated TIPS, anticipating that inflation, while potentially peaking, will remain above historical norms for an extended period.
- We continue to hold a long position in Emerging Market (EM) local rates for the attractive carry and prospect for lower rates.
Fixed Income Team Views
Central Bank Watch
US Fed (Fed)
US headline inflation at 3.4% seemed routine at first glance, but it broke a streak of five consecutive hotter-than-expected upside surprises. Core inflation, which had been rising for six months, finally dipped. This provided some relief and led to lower yields on the curve, as it reinforced the expectation of a return to normalized inflation and ahead of the June forecast meeting next month. While denying any rate action higher, the Fed continue to be hawkish promoting the higher for longer camp, even as we see a soft patch of economic data and labor market coming more into balance.
Bank of Canada (BoC)
The cooler CPI of 2.7% solidified the ground for BoC, as the average measure core inflation breaks 3% for the first time in nearly three years. The position and momentum of all the Bank’s principal metrics are aligned and supportive of easier policy - as early as their next meeting in June. The miss in Q1 Canadian GDP at 1.7% and 6.2% Unemployment rate reinforced our view the BoC will go ahead with a first cut. Markets are moving to price in more divergence between the BoC and the Fed.
European Central Bank (ECB)
Eurozone inflation at 2.6% picked up in May (vs 2.4% in April) as prices of services rose more rapidly, but that is unlikely to deter the European Central Bank from proceeding with a heavily signaled interest-rate cut next week. On the wages side that has that is an issue the bank had been waiting for. The Q1 wages data, released last month, was clearly hotter than expected. It was back up to the Q3 numbers kind of going the wrong way. So that has caused a lot of people in the market to be concerned about the depth and cadence or speed of the ECB easing cycle.
Bank of Japan (BoJ)
Japanese government bond yields have been gradually rising since the BoJ decided to end negative interest rates and abandon its control over bond yields in March. The view for early monetary tightening in Japan has been growing as the yen’s continued weakness raises fears over long-lasting inflation. Overall prices rose 2.5% from a year earlier in April, staying above the central bank’s 2% target. Japan government’s currency intervention came as the yen plunged to a three-decade low in late April, falling to around 160 to the dollar. The wide gap in interest rates between Japan and the U.S. has led to the weakening of the yen in recent years.
Emerging Markets (EM)
EM debt recouped the losses of the prior month with a gain of 0.5% supported by a turnaround in US treasury yields and a stabilisation of the USD. However, sustained gains will likely require stronger signals of US disinflation and Fed rate cuts. Inflation dynamics remain a tailwind for the market; inflation has fallen significantly from cycle peaks across Latam economies. Real-yield levels are significantly above their historical averages in Brazil, South Africa and Mexico which should allow central banks to continue to ease very tight monetary policy stances, and in some cases to accelerate the pace of easing.
Duration and Curve Positioning
We prefer to be invested in high-grade corporate bonds at the short end of the curve and prefer the Canadian curve over the US curve in this sector. As divergence continues to increase, our continued appreciation for the Canadian bond market looks to be well-placed and reaffirmed. The longer end of the Canadian market remains less convincing with 30y Canadian bonds yield near 100bps less than their US equivalents, making the US more attractive. We maintain a positive stance on duration in North America, particularly in Canada, and continue to maintain a significant active underweight duration view in regions where rates are expected to rise further, notably Japan. We have taken some profit on our short JGB trades as some of the original rationale for the trade has come to fruition but continue to see additional upside in the quarters ahead if the BoJ continues along its hawkish path. We continue to hold a long position in Emerging Market (EM) local rates for the attractive carry and prospect for lower rates in Latam.
Investment Grade Corporates (IG)
In May, the IG corporates contributed to performance with a return of +1.47% in Canada and +1.85% in the US as yields fell ~23 bps on weaker than forecasted inflation and non-farm payrolls, helped soothe some concerns that progress on disinflation might have stalled. We favour the investment grade corporate bond space from a total return perspective and more so on the front end of the Canadian curve which is influenced by the policy actions from BoC and divergent form the Fed.
High Yield bonds (HY)
High-yield bonds provided their strongest gains of 2024 in May amid strong earnings, the largest retail inflows since November, an active primary market, and a cooperative macro narrative. The US HY Index gained +1.18% in May with BBs (+1.21%) outperforming Single Bs (+1.17%) and CCCs (+0.85%). High-yield bond yields decreased 13bp and spreads increased 6bp in May to 8.14% and 349bp respectively. Decreasing yields typically benefit credit spreads by lowering funding costs for companies and boosting consumer purchasing power. However, we're cautious because rate cuts, especially if an economy is sliding into recession (more probable in Canada), would reverse these effects. Additionally, the narrow credit spreads indicate an unfavorable entry point for taking on significant credit risk.
Leveraged loans (LL)
Loan prices rallied as risk assets surged on investor expectations that the Federal Reserve will achieve its aim of guiding the US economy to a soft landing. The US Leveraged Loan gained 0.94% in May, the strongest month this year, up from 0.60% in April. Higher rated BBB (+0.79%) and BB (+0.77%) rated loans underperformed versus B rated loans (return of +0.99%) in May, while 2L loans (+2.19%) and riskiest CCC loans (+1.26%) outperformed during this period. The market continues to remain in a net supply draught at repricing amendments again dominated the supply, accounting for a record-breaking $119 billion, or 66% of the total. In terms of demand, managers printed $23.5 billion of new CLOs last month. We reflect our neutral view on loans as we see a good opportunity to receive higher coupons & favour higher quality loans in the current economic cycle.
Bond stories
Investment Grade Bond – Intact Financial
Intact Financial is the largest provider of property and casualty insurance in Canada and has a growing presence in the U.S., U.K. and internationally. The company has a long history of growing premiums and gaining market share in their core markets and has also grown through acquisitions which have added diversification to their business. In recent quarters, they have benefited from low catastrophe losses and the favorable impact of pricing actions in insurance premiums. These developments have resulted in industry-leading combined ratios and strong earnings generation. As a result, this has enabled them to reduce debt ahead of schedule and consistently maintain their capital levels above regulatory targets, which positions them well to deal with potential market stress events. Intact Financial bonds have seen meaningful spread compression on the back of these strong results. While we have been long-term holders of their senior notes, we have also been comfortable taking risk in their lower-ranked LRCNs which were notable contributors in the month of May.
High Yield Bond – Videotron
Videotron is the 4th largest telecommunications company in Canada with a historical concentration in the Quebec market. In 2023, they completed their acquisition of Freedom Mobile, which effectively doubled their number of wireless subscribers and expanded their geographic reach in English-speaking parts of
Canada. Importantly, Freedom provided them a platform for long-term growth and was acquired on terms that allowed them to maintain low leverage, consistent with their investment grade rated peers. Rating agencies took note of this developments and have had Videotron on positive ratings watch since the start of the year. This past month, the agencies finally acted and upgraded Videotron to low-BBB, allowing their bonds make their highly anticipated debut as part of the investment grade index. Unsurprisingly, bond spreads reacted positively to this milestone event and were notable outperformers in the month of May. We continue to like the Videotron credit story and relative value on offer and maintain a large position in their bonds.
ESG – Atlantica Sustainable Infrastructure
Atlantica owns a portfolio of power generation, transmission, and water desalination assets globally. We like the credit because company cashflows are 100% regulated/contracted, secular tailwinds supportive of renewable power asset owners globally, and the diversified nature of the company’s assets. We participated in this green bond in FY 2021when the net proceeds were used to repurchase existing debt that was not labelled. As such given fundamentals of the credit and the potential rumors of being acquired, we doubled down on our exposure at a lower dollar price during a period of weaker credit markets in 2022. This decision resulted in a very healthy exposure to the issuer across all our mandates, including our ESG mandates. In May, our thesis paid off when the company’s bonds rose by ~+7-8 points because of the announcement of being acquired by ECP. From an ESG perspective, the company provides its environmental policy and annual ESG reports on its investor relations website. In FY 2023, AY avoided 7million metric tons of CO2 and had ~89% of EBITDA generated from low carbon footprint assets. It also achieved multiple ESG credentials in FY 2023 including multiple leadership credentials from CDP, top rated ESG rating for the utility industry from Sustainalytics and approved science based GHG emission reduction targets.
Commissions, trailing commissions, management fees, and expenses all may be associated with mutual fund investments. Please read the prospectus before investing. The indicated rates of return are the historical annual compounded total returns as of May 31, 2024, including changes in share value and reinvestment of all distributions and does not take into account sales, redemption, distribution, or optional charges or income taxes payable by any security holder that would have reduced returns. Mutual funds are not guaranteed, their values change frequently, and past performance may not be repeated. Index performance does not include the impact of fees, commissions, and expenses that would be payable by investors in the investment products that seek to track an index.
Index performance does not include the impact of fees, commissions, and expenses that would be payable by investors in investment products that seek to track an index.
This document may contain forward-looking information which reflect our or third party current expectations or forecasts of future events. Forward-looking information is inherently subject to, among other things, risks, uncertainties and assumptions that could cause actual results to differ materially from those expressed herein. These risks, uncertainties and assumptions include, without limitation, general economic, political and market factors, interest and foreign exchange rates, the volatility of equity and capital markets, business competition, technological change, changes in government regulations, changes in tax laws, unexpected judicial or regulatory proceedings and catastrophic events. Please consider these and other factors carefully and not place undue reliance on forward-looking information. The forward-looking information contained herein is current only as of May 31, 2024. There should be no expectation that such information will in all circumstances be updated, supplemented or revised whether as a result of new information, changing circumstances, future events or otherwise.
The content of this commentary (including facts, views, opinions, recommendations, descriptions of or references to, products or securities) is not to be used or construed as investment advice, as an offer to sell or the solicitation of an offer to buy, or an endorsement, recommendation or sponsorship of any entity or security cited. Although we endeavour to ensure its accuracy and completeness, we assume no responsibility for any reliance upon it.
All information is historical and not indicative of future results. Current performance may be lower or higher than the quoted past performance, which cannot guarantee results. Share price, principal value, and return will vary, and you may have a gain or a loss when you sell your shares. Performance assumes reinvestment of distributions and does not account for taxes. Performance may not reflect any expense limitation or subsidies currently in effect. Short-term trading fees may apply.
This material is for informational and educational purposes only. It is not a recommendation of any specific investment product, strategy, or decision, and is not intended to suggest taking or refraining from any course of action. It is not intended to address the needs, circumstances, and objectives of any specific investor. Mackenzie Investments, which earns fees when clients select its products and services, is not offering impartial advice in a fiduciary capacity in providing this sales and marketing material. This information is not meant as tax or legal advice. Investors should consult a professional advisor before making investment and financial decisions and for more information on tax rules and other laws, which are complex and subject to change.
The rate of return is used only to illustrate the effects of the compound growth rate and is not intended to reflect future values of the mutual fund or returns on investment in the mutual fund.