
Liquidity refers to the ease and speed with which an asset can be converted into cash, without negatively impacting the price. Liquidity is usually seen as something valuable and highly desirable. A lack of liquidity is often considered risky, because illiquid assets can’t be turned into cash in the case of sudden, unforeseen expenses.
The benefits of illiquidity
Many investors don’t realize that liquidity comes at a cost. Data shows that investors face a trade-off between the flexibility and convenience of easily tradeable liquid investments and the higher historical returns generated by less-liquid private market investments.
This excess return from illiquid investments — the illiquidity premium — can be viewed as additional compensation paid to investors in exchange for the inconvenience of limited liquidity. It can also be viewed as a cost imposed on more liquid forms of investment that offer greater flexibility to investors.
The chart below illustrates the average return difference between liquid and illiquid versions of the same asset classes, assuming a 10-year holding period. It shows that a significant return difference exists in each of these major asset classes.
What creates the illiquidity premium?
In our view, this excess return is derived from a number of factors that work in favour of businesses and fund managers operating in the private capital markets. These factors are not present in public markets (at least to the same extent) and have historically combined to create superior value for private market investors over time.
Operational control
- Private equity managers typically take majority/controlling positions in their portfolio companies.
- This contrasts with public equity managers, who typically take very small minority positions in the business they own; they are often just one of hundreds or even thousands of owners.
- A control position allows the investor/owner to implement larger-scale and potentially transformational changes that actively contribute to private company value enhancement in a way that passive public share ownership typically can’t.
More room for growth
Private companies range from very small scale, early-stage businesses to more mature, large, multi-national corporations. By the time a company embarks on an initial public offering (IPO), much of the initial-stage growth has often occurred, and private investors have already accrued significant returns.
Informational advantages
Private managers can access and analyze material, non-public information on private companies before deciding to invest; this can lead to better investment decisions. This is not allowed in public markets.
Patient, long-term capital
Private asset managers benefit from investor capital that is much less likely to be withdrawn during market turmoil. There is also no regulatory requirement to publicly report quarterly financials. The certainty of investor funding and distance from quarterly earnings targets allows private businesses to enact longer-term planning compared to publicly traded companies.
Control over exit timing
Public markets always reflect current investor sentiment, positive or (overly) negative. Private managers can choose the timing of an asset sale and so tend to choose times when asset prices are strong. This can help boost the long-term value creation record of private asset managers versus public markets.
Limited intermediaries
Public stock and bond markets contain intermediaries that are paid to create liquidity. These include large investment banks (that do much of the underwriting and IPO-related work) and stock exchanges/broker dealer networks (that facilitate secondary market activity). These intermediation services come at an added cost to public market returns.
We view these attributes of private markets to be structural in nature, which may have positive implications for the persistence of the private markets illiquidity premium we describe here.
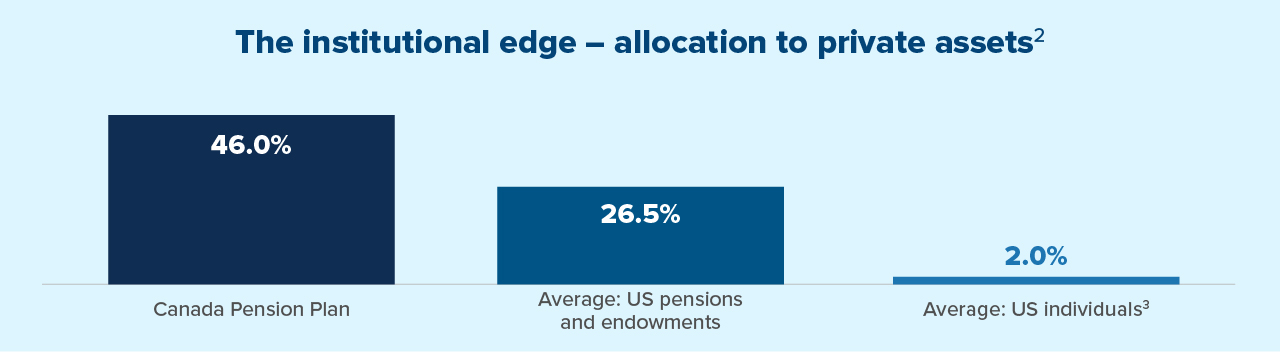
For most individual investors, this hidden superpower is left unused
Many individual investors have historically assumed that their investment portfolio should be fully liquid and easily sold if needed, since, typically, their other major asset — their home — is illiquid.
As a result, we believe that individual investors have been significantly under-invested in private, illiquid assets compared to institutional investors, such as pension plans, endowments and foundations. This reluctance to invest in illiquid assets has meant that individual investors have generally not participated in, or benefitted from, possible excess returns that may have been available from the illiquidity premium described above.
How much liquidity do investors really need?
The chart below provides data on the annual aggregate Canadian mutual fund industry assets, organized by type of mutual fund. While this provides only a partial view of individual Canadian investors’ total financial assets (share ownership in brokerage and self-directed accounts and bank balances are among the assets not captured here), we can see that the allocation across equity, fixed income, balanced and money market funds is relatively steady, from year to year. In particular, the allocation to money-market funds is low and has trended down over the 2006-2022 period.
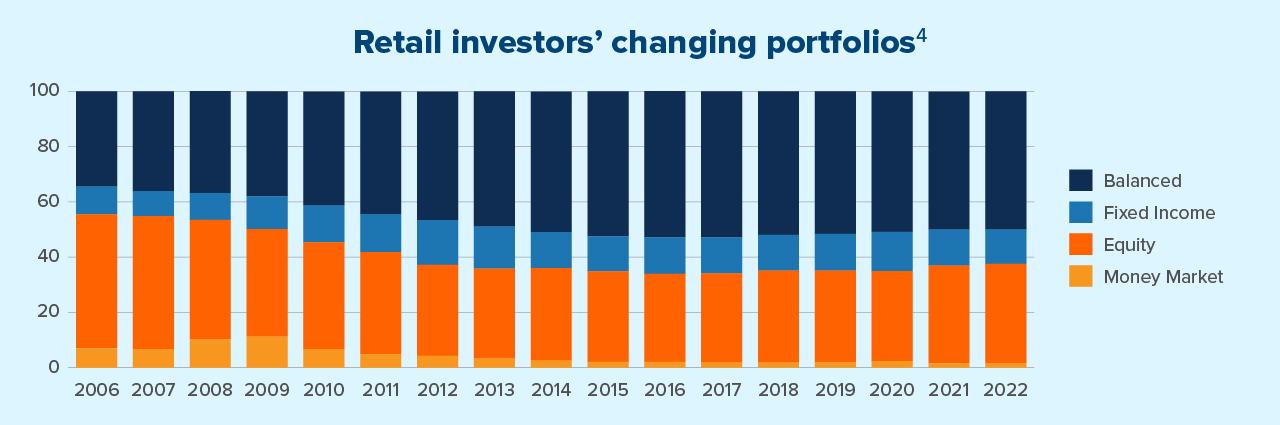
While these are all liquid mutual funds, this data suggests Canadian retail investors are not shifting allocations in any major way in response to market conditions. While investors say they value the ability to liquidate investments for cash, their behaviour seems to show that they don’t take advantage of this option.
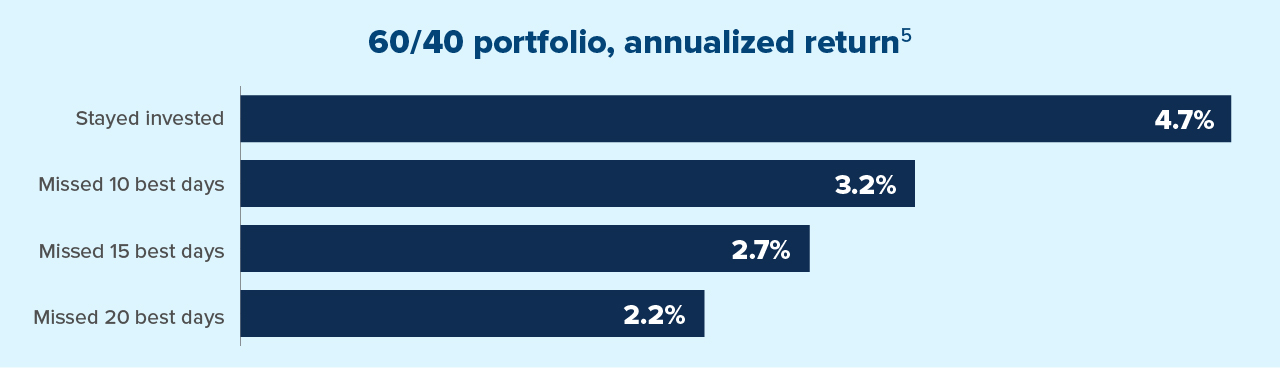
And this is a good thing because market timing is notoriously difficult. The chart below analyzes returns on a global 60/40 portfolio from January 1999 to October 2022. It shows that the annualized returns on this 60/40 portfolio are reduced by 32% if an investor is out of the market and misses just the 10 best returning days over that period. Similarly, annual returns are cut by 43% from missing the best 15 days and by a sizeable 53% if just 20 of the best days are missed by being out of the market. The perils of market timing are significant.
Is it worth paying for a service you’re not using?
In summary, liquidity is a service provided by public market intermediaries, which comes at a cost. There are numerous advantages to operating a company and/or managing a fund in the private capital markets that are not available to public market investors, and those advantages have historically tended to produce superior returns for investors over time. Liquid investment funds also do not provide exposures to the large universe of private companies that can offer compelling growth and value-creation potential.
The vast majority of retail investors probably don’t need as much liquidity as they think they do. The data shows that most investors are not active traders within their mutual fund accounts. Many investors don’t need 100% of their financial assets to be fully liquid at all times. And private market assets, including equity, credit and infrastructure are now more accessible than ever.
In fact, many investors may have been better off trading a portion of that liquidity for the extra return premium that has historically been available from investing in private assets — a return premium that comes from permanent features of private markets that we can reasonably expect to see continue.
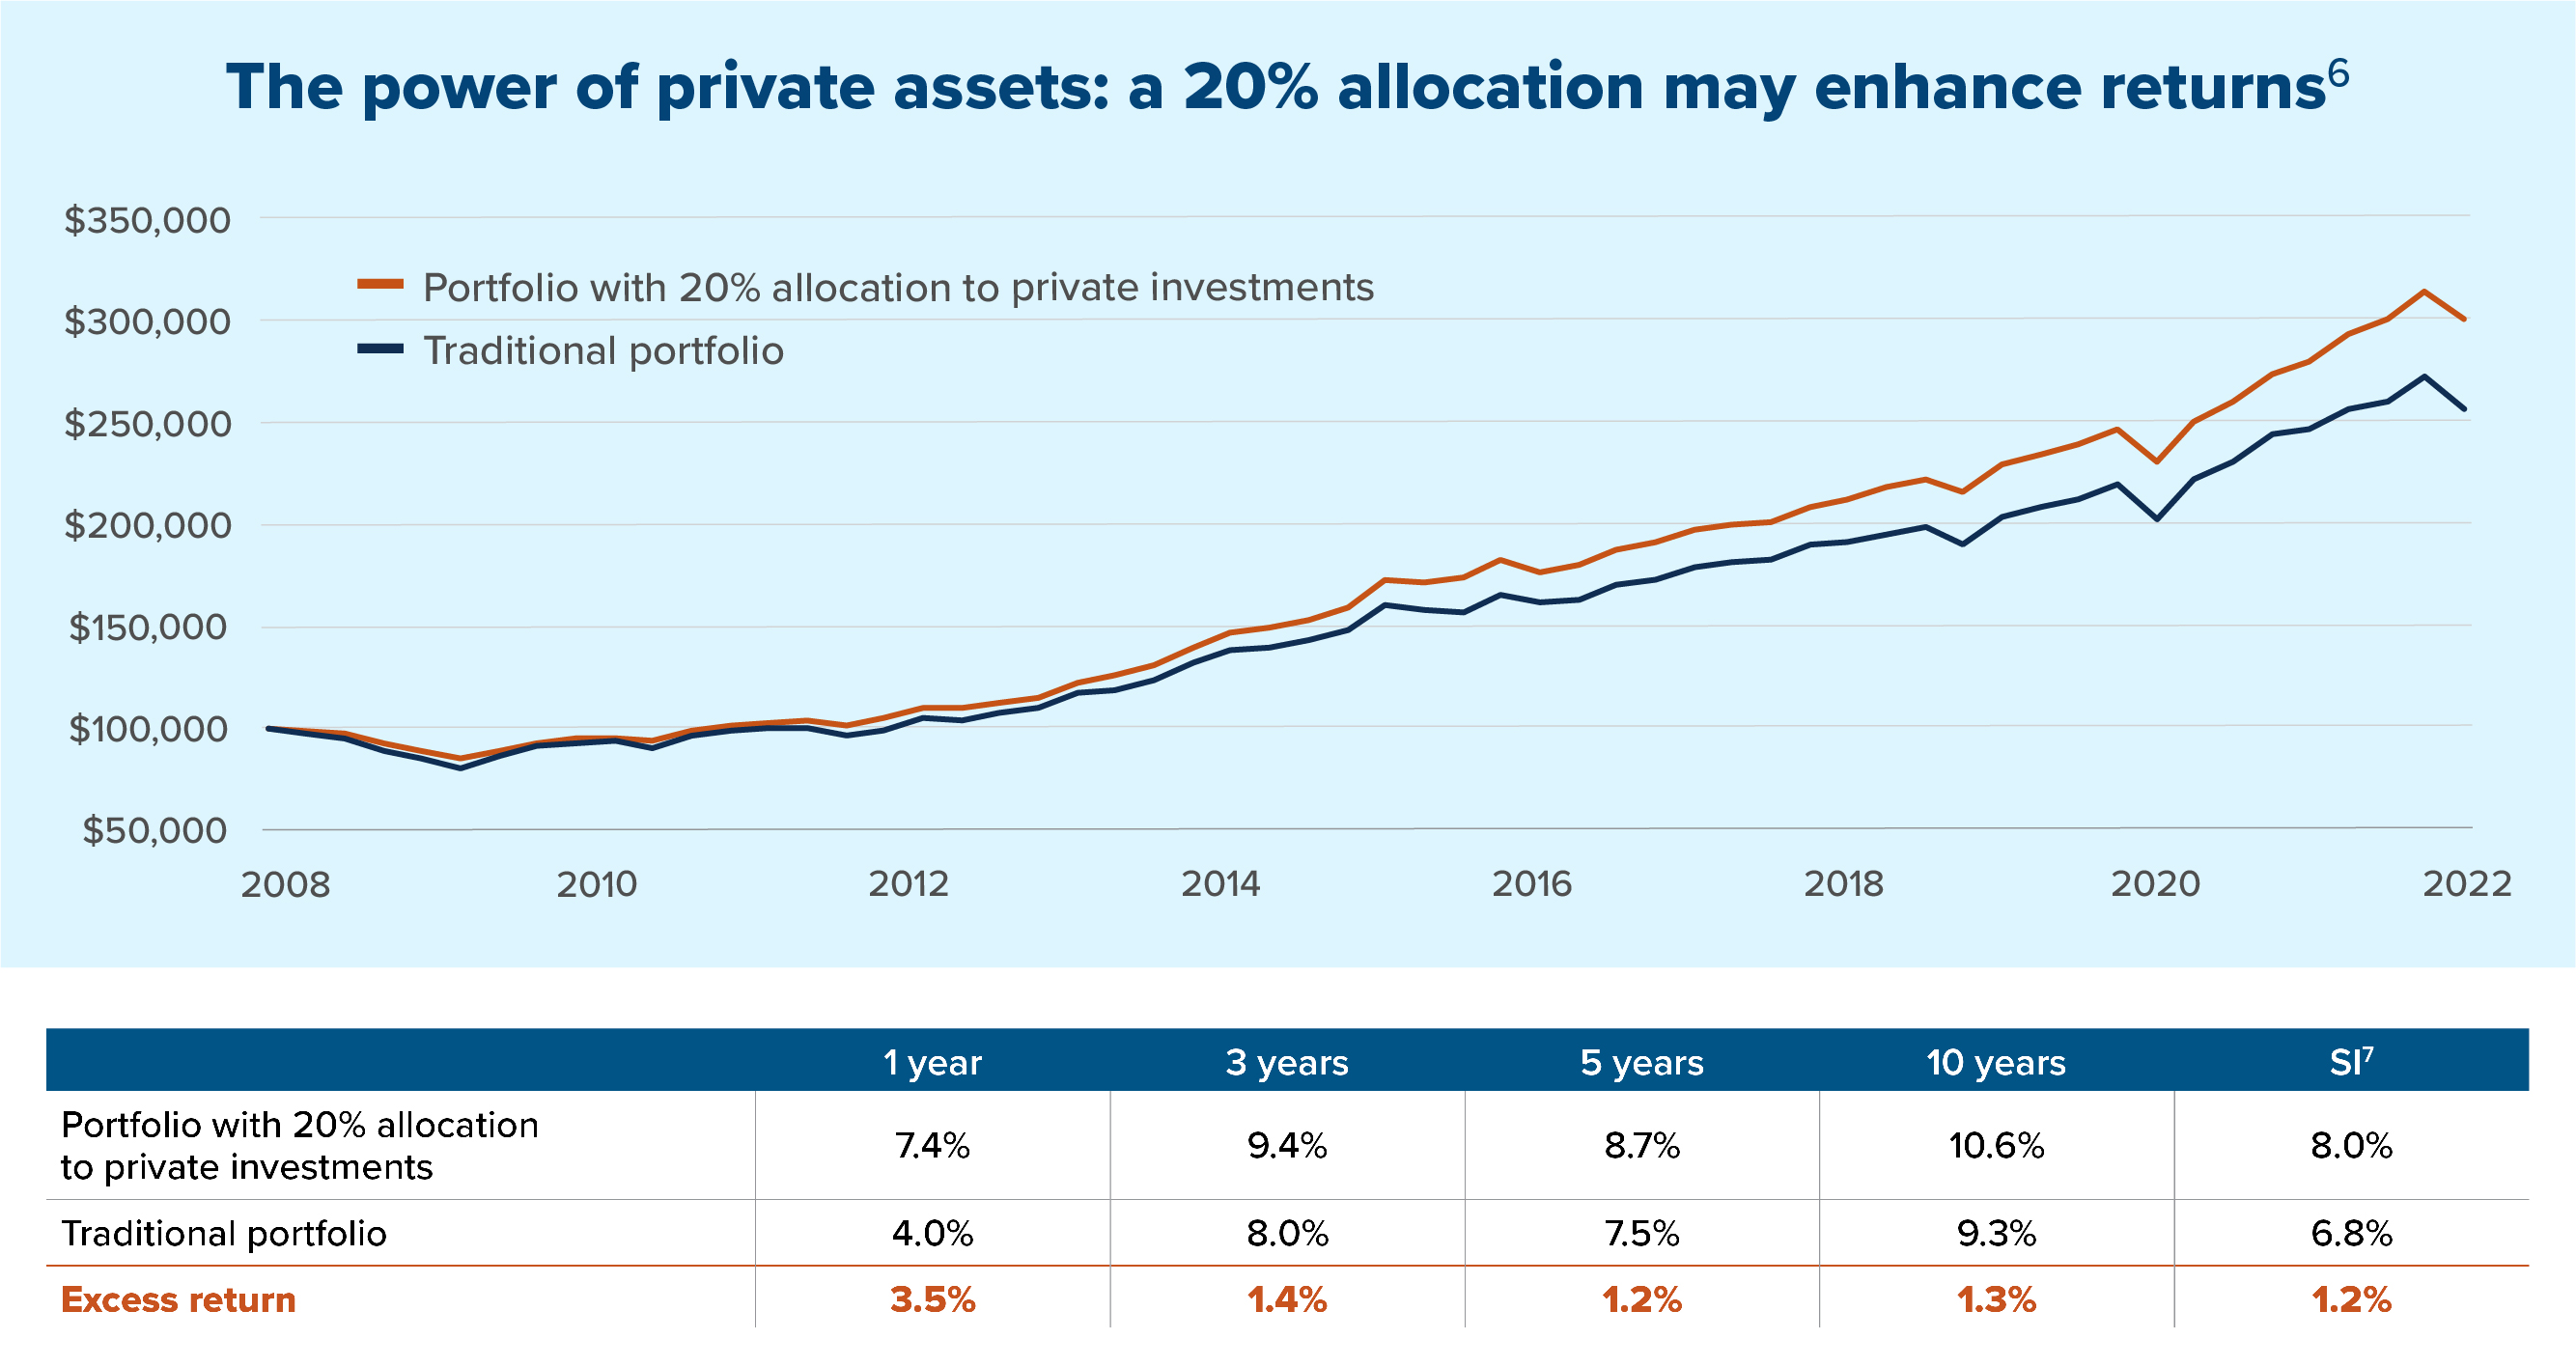
The chart below shows the growth of $10,000 invested over approximately 15 years in two competing portfolios: a basic public market portfolio (60% equities and 40% bonds) and a balanced portfolio that contains a 20% allocation to private assets. Over the full sample period, a balanced investor could have earned an extra 1.3 percentage points per year by supplementing their traditional fully liquid portfolio with an allocation to less-liquid assets. After 15 years, the broader portfolio containing illiquid assets has grown from $100,000 to approximately $300,000, about $44,000 (or 17%) more than the fully liquid 60/40 version.
Learn more about how private market assets are key to a modern diversified portfolio.
1 Quarterly returns in CAD. Private equity excess return is calculated as the average difference between the rolling 10-year returns of the Cambridge US Private Equity (LEGACY DEFINITION) Index and the MSCI World TR Index between December 2009 and December 2022. Private infrastructure excess return is calculated as the average difference between the rolling 10-year returns of the Preqin Private Infrastructure Index and the S&P Global Infrastructure TR Index between December 2017 and December 2022. Private debt excess return is calculated as the average difference between the rolling 10-year returns of the Preqin Private Debt Index and the ICE BofA Gbl Brd Mkt TR HCAD between December 2010 and December 2022.
2 Sources: Canada Pension Plan Investment Board, Annual Report, 2021 (based on leveraged assets); Willis Towers Watson Global Pension Assets Study 2021; NACUBO-TIAA Study of Endowments; PitchBook Data Inc.
3 Note: Represents the upper end of an estimated 1% to 2% range.
4 Time period is from 2006 to September 2022. Assets do not include ETFs. Money Market assets are represented by the following CIFSC categories: Canadian Money Market, Canadian Synthetic Money Market, and U.S. Money Market. Equity assets are represented by the following CIFSC categories: Asia Pacific Equity, Asia Pacific ex-Japan Equity, Canadian Dividend & Income Equity, Canadian Equity, Canadian Focused Equity, Canadian Focused Small/Mid Cap Equity, Canadian Small/Mid Cap Equity, Emerging Markets Equity, Energy Equity, European Equity, Financial Services Equity, Geographic Equity, Global Equity, Global Small/Mid Cap Equity, Greater China Equity, International Equity, Natural Resources Equity, North American Equity, Science & Technology Equity, Sector Equity, U.S. Equity, U.S. Small/Mid Cap Equity. Fixed Income assets are represented by the following CIFSC categories: Canadian Corporate Fixed Income, Canadian Fixed Income, Canadian Inflation Protected Fixed Income, Canadian Long Term Fixed Income, Canadian Short Term Fixed Income, Emerging Markets Fixed Income, Floating Rate Loan, Global Corporate Fixed Income, Global Fixed Income, High Yield Fixed Income, and Preferred Share Fixed Income. Balanced assets are represented by the following CIFSC categories: Canadian Equity Balanced, Canadian Fixed Income Balanced, Canadian Neutral Balanced, Global Equity Balanced, Global Fixed Income Balanced, Global Neutral Balanced, and Tactical Balanced. CIFSC categories removed include: Target Date Portfolio categories, Alternatives categories, Miscellaneous - Other, Miscellaneous - Undisclosed Holdings, and Other Investments.
5 Daily returns in CAD. Time period is from Jan 4, 1999 to Oct 31, 2022. 60/40 Portfolio is represented by 60% of the MSCI World TR Index and 40% of the ICE BofA Gbl Brd Mkt TR HCAD Index.
6 Quarterly returns in CAD. Time period is from December 2007 to March 2022. Traditional portfolio consists of 60% MSCI World TR + 40% ICE BofA Gbl Brd Mkt TR HCAD. Portfolio with 20% allocation to private investments consists of 47.5% MSCI World TR + 32.5% ICE BofA Gbl Brd Mkt TR HCAD + 10% Cambridge US Private Equity (LEGACY DEFINITION) + 5% Preqin Private Debt + 5% Preqin Private Infrastructure.
7 Since Inception: December 2007.
Commissions, trailing commissions, management fees and expenses all may be associated with mutual fund investments. Please read the prospectus before investing. Mutual funds are not guaranteed, their values change frequently and past performance may not be repeated.
This document may contain forward-looking information which reflect our or third-party current expectations or forecasts of future events. Forward-looking information is inherently subject to, among other things, risks, uncertainties and assumptions that could cause actual results to differ materially from those expressed herein. These risks, uncertainties and assumptions include, without limitation, general economic, political and market factors, interest and foreign exchange rates, the volatility of equity and capital markets, business competition, technological change, changes in government regulations, changes in tax laws, unexpected judicial or regulatory proceedings and catastrophic events. Please consider these and other factors carefully and not place undue reliance on forward-looking information. The forward-looking information contained herein is current only as of January 15, 2023. There should be no expectation that such information will in all circumstances be updated, supplemented or revised whether as a result of new information, changing circumstances, future events or otherwise.
The content of this article (including facts, views, opinions, recommendations, descriptions of or references to, products or securities) is not to be used or construed as investment advice, as an offer to sell or the solicitation of an offer to buy, or an endorsement, recommendation or sponsorship of any entity or security cited. Although we endeavour to ensure its accuracy and completeness, we assume no responsibility for any reliance upon it.